Add chart category
-
1
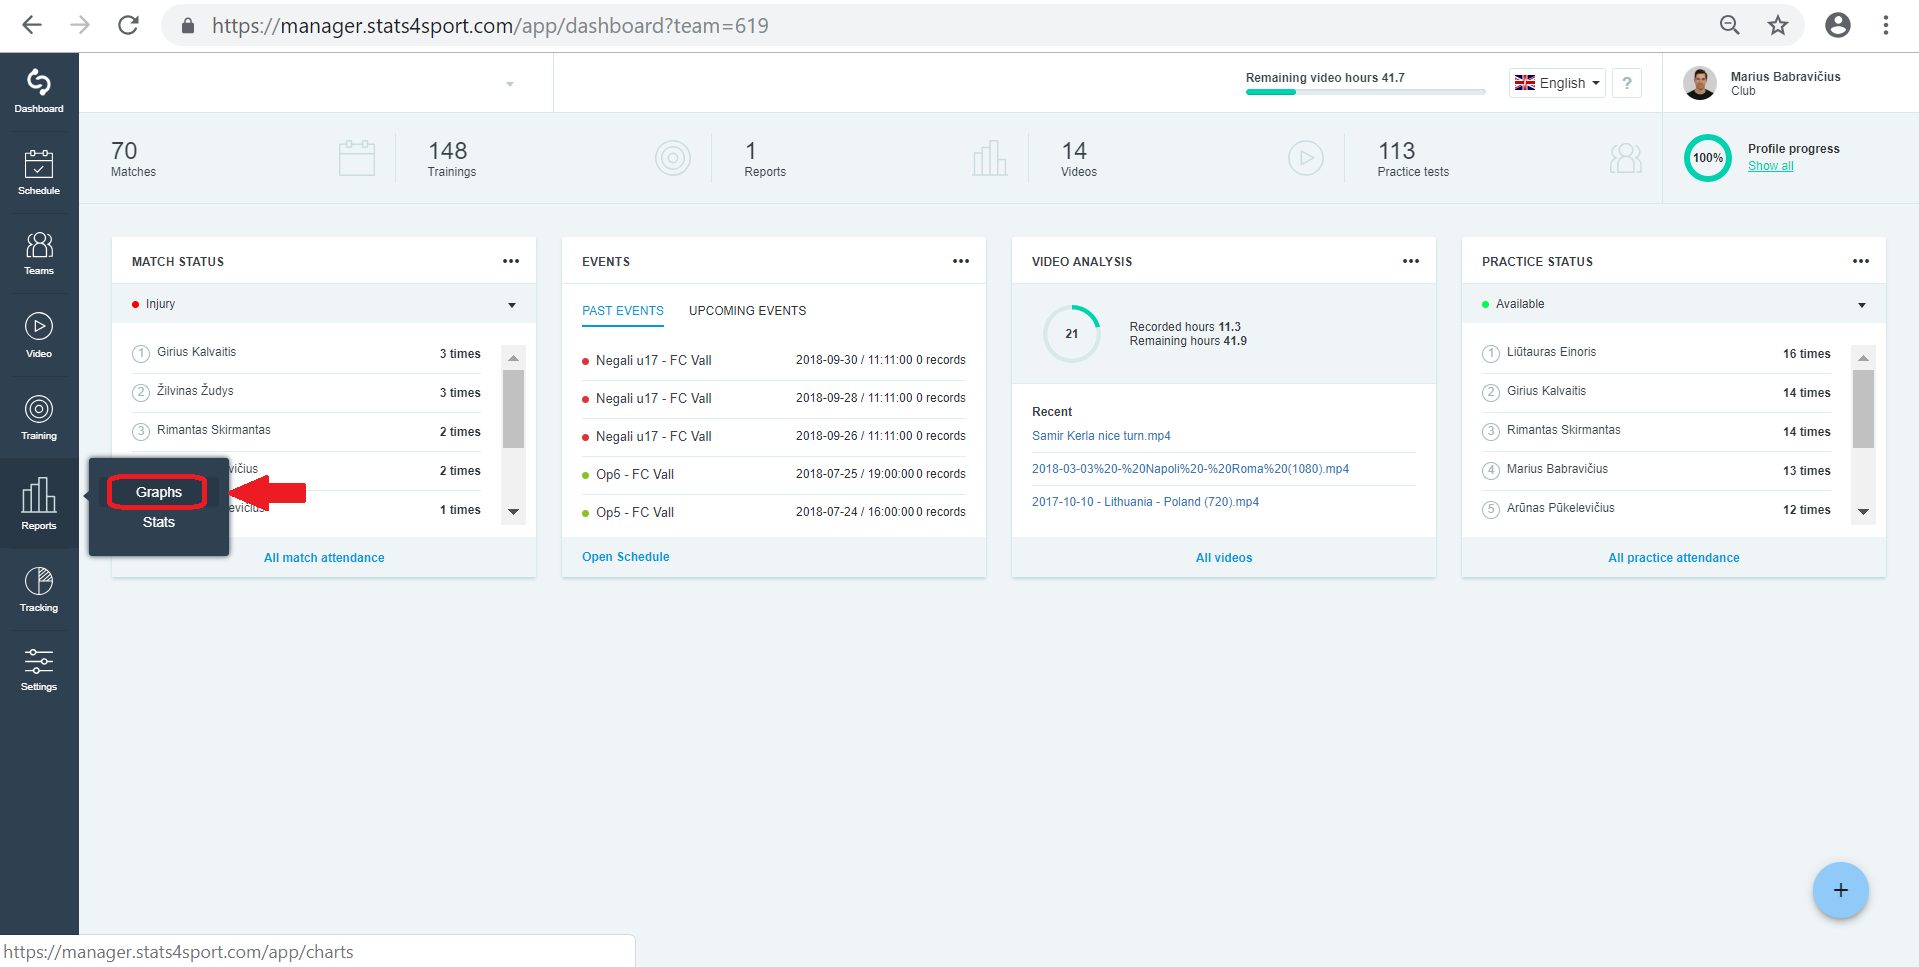
Go to "Reports" menu on the left. Choose "Graphs".

-
2
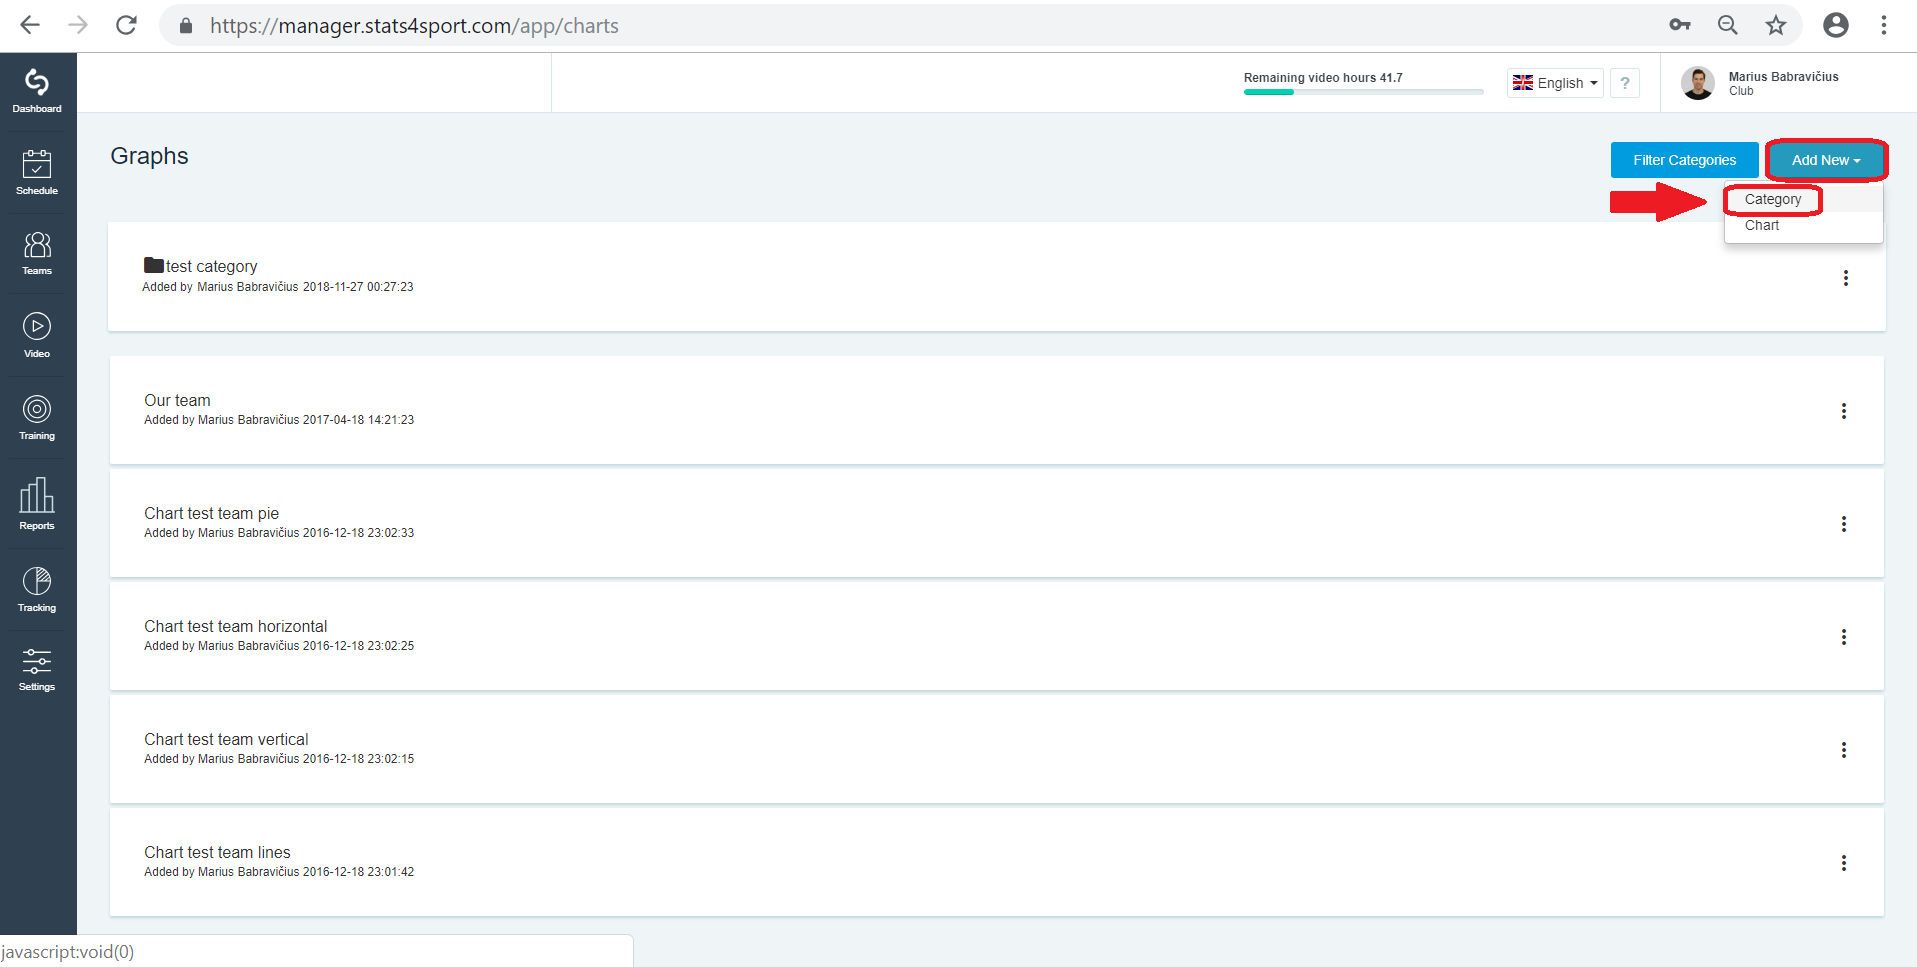
To add chart category press "Add new" -> "Category".

-
3
Enter category title and click "SAVE".
Was this article helpful?
READ NEXT


